Reduction of Non-Productive Time in Apparel Manufacturing: A Garment Factory Case
Abstract
Rimsa Taimy1* and Shafiullah Khan2
1Department of Apparel Engineering, Bangladesh University of Textiles, Dhaka, Bangladesh
2Department of Textile Engineering Management, Bangladesh University of Textiles, Dhaka, Bangladesh
1Contact: rimsataimy@gmail.com
Received: March 10, 2025; Revised: March 28, 2025; Published online : March 30, 2025
Garment manufacturers constantly seek methods to improve efficiency and productivity. Thus, the study was undertaken to identify non-productive time (NPT) and analyze the root causes. The effect of NPT on productivity standard minute value, labor efficiency, and targets was also analyzed in an apparel manufacturing unit of Bangladesh. The study discusses various approaches to reduce NPT. These include applying time study why-why-bacause of logic (WWBLA), fishbone techniques to minimize the NPT of cutting and sewing process, and detecting the reason for NPT through root cause analysis and the process through which it can be reduced. The effectiveness of these strategies demonstrates efficiency gains and positive impacts on productivity. The productivity improved 6-10% after taking countermeasures against the NPT. The study highlights the importance of precise time measurements and workflow analysis in identifying and eliminating NPT. By implementing these methods, garment manufacturers can achieve operational excellence, minimize process waste, and enhance competitiveness.
Full Text
1. INTRODUCTION
Garment manufacturing is the final stem, where finished fabrics are cut into panels and assembled by sewing operations [1]. The productivity of a garment manufacturing unit mainly depends on the performance of the cutting and sewing section [2]. Standard minute value (SMV) is the basic indicator that measures the time taken to produce a piece of garment depending on the type of garment style and operational efficiency [3]. Operational efficiency can be measured by the proper utilization of manpower, machines, management know-how, and operational tools and techniques [4]. Maximization of operational efficiency contributes to the cost of the garment and supply chain efficiency and responsiveness [5].
Efficiency focuses on cost, and responsiveness focuses on speed and flexibility of the production process. One of the main indicators of the responsiveness is the lead time. The inefficiency leads to extended lead times, ranging from 45 to 90 days [6]. The lack of efficiency not only prolongs lead times but also increases production costs. Consequently, despite benefiting from the world’s lowest labor costs, it incurs higher manufacturing expenses. Non-productive time activities of the production process in the cutting and sewing section are responsible for the inefficiency of the garment manufacturing unit [7]. Non-productive time (NPT) includes waiting time, inefficient movement due to poor layout, improper line balancing, inadequate planning, improper machine utilization, sharing of work instruments, absence of operators, and worker fatigue [8-12].
Time study, a work measurement technique, records the time taken to perform specific tasks or elements under defined conditions and analyzes the data to determine the necessary time for an operator to perform at a set performance rate [13]. Time study is widely used for balancing sewing lines among different workstations so that subassemblies do not stock at a workstation and create bottlenecks. In the apparel industry, it can often be challenging to identify key areas and practices that can enhance current processes and systems. Operators of the sewing line and cutting section require training to get maximum output in the process [14]. They often make mistake in the production process due to their poor skill and lack of awareness [15].
Proper training makes them skilled and motivated to work. Machines or equipment also play a significant role in operational efficiency [16]. The mechanical condition of the machinery and their frequent adjustments are required to achieve optimum performance of the machinery and equipment [17]. A working environment with proper lighting, management, and sufficient utilities for the employees is also a factor for productivity [18]. Therefore, NPT of the operator, machine, management, and environment are the vital issues for the inefficient production process.
Using this tool like time study, why-why-because logical analysis (WWBLA), and fishbone diagram, it is possible to map the current status and subsequently analyze it to achieve better targets. The WWBLA is an analytical and simple organizing technique to find out the root causes of a problem. In this tool, it is necessary to ask “why” many times to identify the root cause of a problem. When a cause is identified, it is called the first factor of a problem. Then, the first factor is verified to see whether it can be divided into further root causes. Then, the second factor for the problem is identified and verified. Similarly, a third factor of the problem is identified. Once it is not possible to identify any factor further, then the verification is stopped. Finally, countermeasures are taken to minimize the problem [19].
A fishbone diagram is a useful tool to determine the possible causes for a problem, but it cannot identify root causes. It shows the causes of any problem in a more structured approach than other brainstorming tools [20]. This study used time study to find out the baseline of the current status of the production process of an apparel factory in Bangladesh. Time study identified non-productive time (NPT) of the cutting and sewing section engaged for three different apparel styles.
WWBLA and fishbone techniques were employed to find the phenomenon and their root cause analysis. Discussion was necessary with management of the factory to share the results obtained from the study. A training module was developed and conducted for the operators of the respective session. Post-effect was finally analyzed without NPT.
The overview of the study framework is visualized in Figure 1. In this study, a simple T-shirt, polo shirt, and hoodie production line were analyzed, and the cutting and sewing line was monitored continuously over two weeks to understand the actual scenario. The objectives of this study were to analyze the baseline NPT in the cutting and sewing section and to examine the effect of NPT on labor efficiency, productivity, and target per hour and to reduce NPT in apparel production. This study successfully identified the root causes for the NPT and improved the production target, SMV, and line labor efficiency.

Figure 1. Study framework for the reduction of non-productive time (NPT) of a garment unit under this study.
2. MATERIALS AND METHODS
2.1 Materials
Three styles of garment, namely T-shirts, polo T-shirts, and hoodies, were selected as materials. The target production per hour, target SMV, and fabric weight in grams per meter (GSM) are presented in Table 1. The H&M buyer placed the order for these three garments to Fakir Apparels Ltd., in Bangladesh.
Table 1. Fabric GSM, target production rate, and SMV used under the buyer order
|
|
T-shirt |
Polo |
Hoodie |
|
Fabric |
1x1 Rib 100% cotton GSM 160 |
1x1 Rib 100% cotton GSM 200 |
1x1 Rib 100% cotton GSM 220 |
|
Target |
150 pcs/hr |
110 pcs/hr |
120 pcs/hr |
|
Target SMV |
7.84 min |
15.71 min |
14.60 min |
|
Buyer |
H&M |
H&M |
H&M |
2.1 Procedure for the determination of Standard Minute Value (SMV) and Target per hour
A stopwatch was used to measure the cycle time for a selected operator. Cycle time means the total time taken by operators to do all the work to complete one operation; for example, the time is counted from pickup of the first piece to pickup of the next piece. Performance rating is the rating where the operator was assigned a performance for doing the job, seeing movement, and working speed. The following equation was used to calculate SMV.
· Basic Time = Cycle Time × performance Rating
· Observed time = Total cycle time /No. of cycle
· Performance rating= Observed time/standard rating x 100
· Basic time = Average Observe time X Rating factor
· SMV (Standard Minute Value) =Basic time + (Basic Time x Allowance %)
· Target/hr = No. of operator x efficiency x 60/ SMV
3. RESULTS AND DISCUSSION
3.1 Analysis of NPT
Non-productive time (NPT) was identified by the observation over two weeks in the cutting and sewing section. Minor and major stoppages were recorded whether they were avoidable or unavoidable causes for NPT. After the two weeks, six types of NPT were identified as a baseline for this study. The NPT is shown in Table 2. For better understanding, NPT was also classified as a percentage. Type-wise total NPT and their percentage are plotted in Figure 2.
Table 2. Category-wise total NPT and NPT percentage
|
Sl. |
Category-wise NPT |
Total NPT |
% of NPT |
|
1 |
Cutting section |
660 |
23.83 |
|
2 |
Sewing section |
280 |
10.12 |
|
3 |
Line settings |
1050 |
37.91 |
|
4 |
Machine maintenance |
230 |
8.30 |
|
5 |
Power failure |
120 |
4.33 |
|
6 |
Material shortage |
180 |
6.50 |
|
7 |
Machine breakdown |
90 |
3.25 |
|
|
Labor delay |
160 |
5.78 |

(a)

(b)
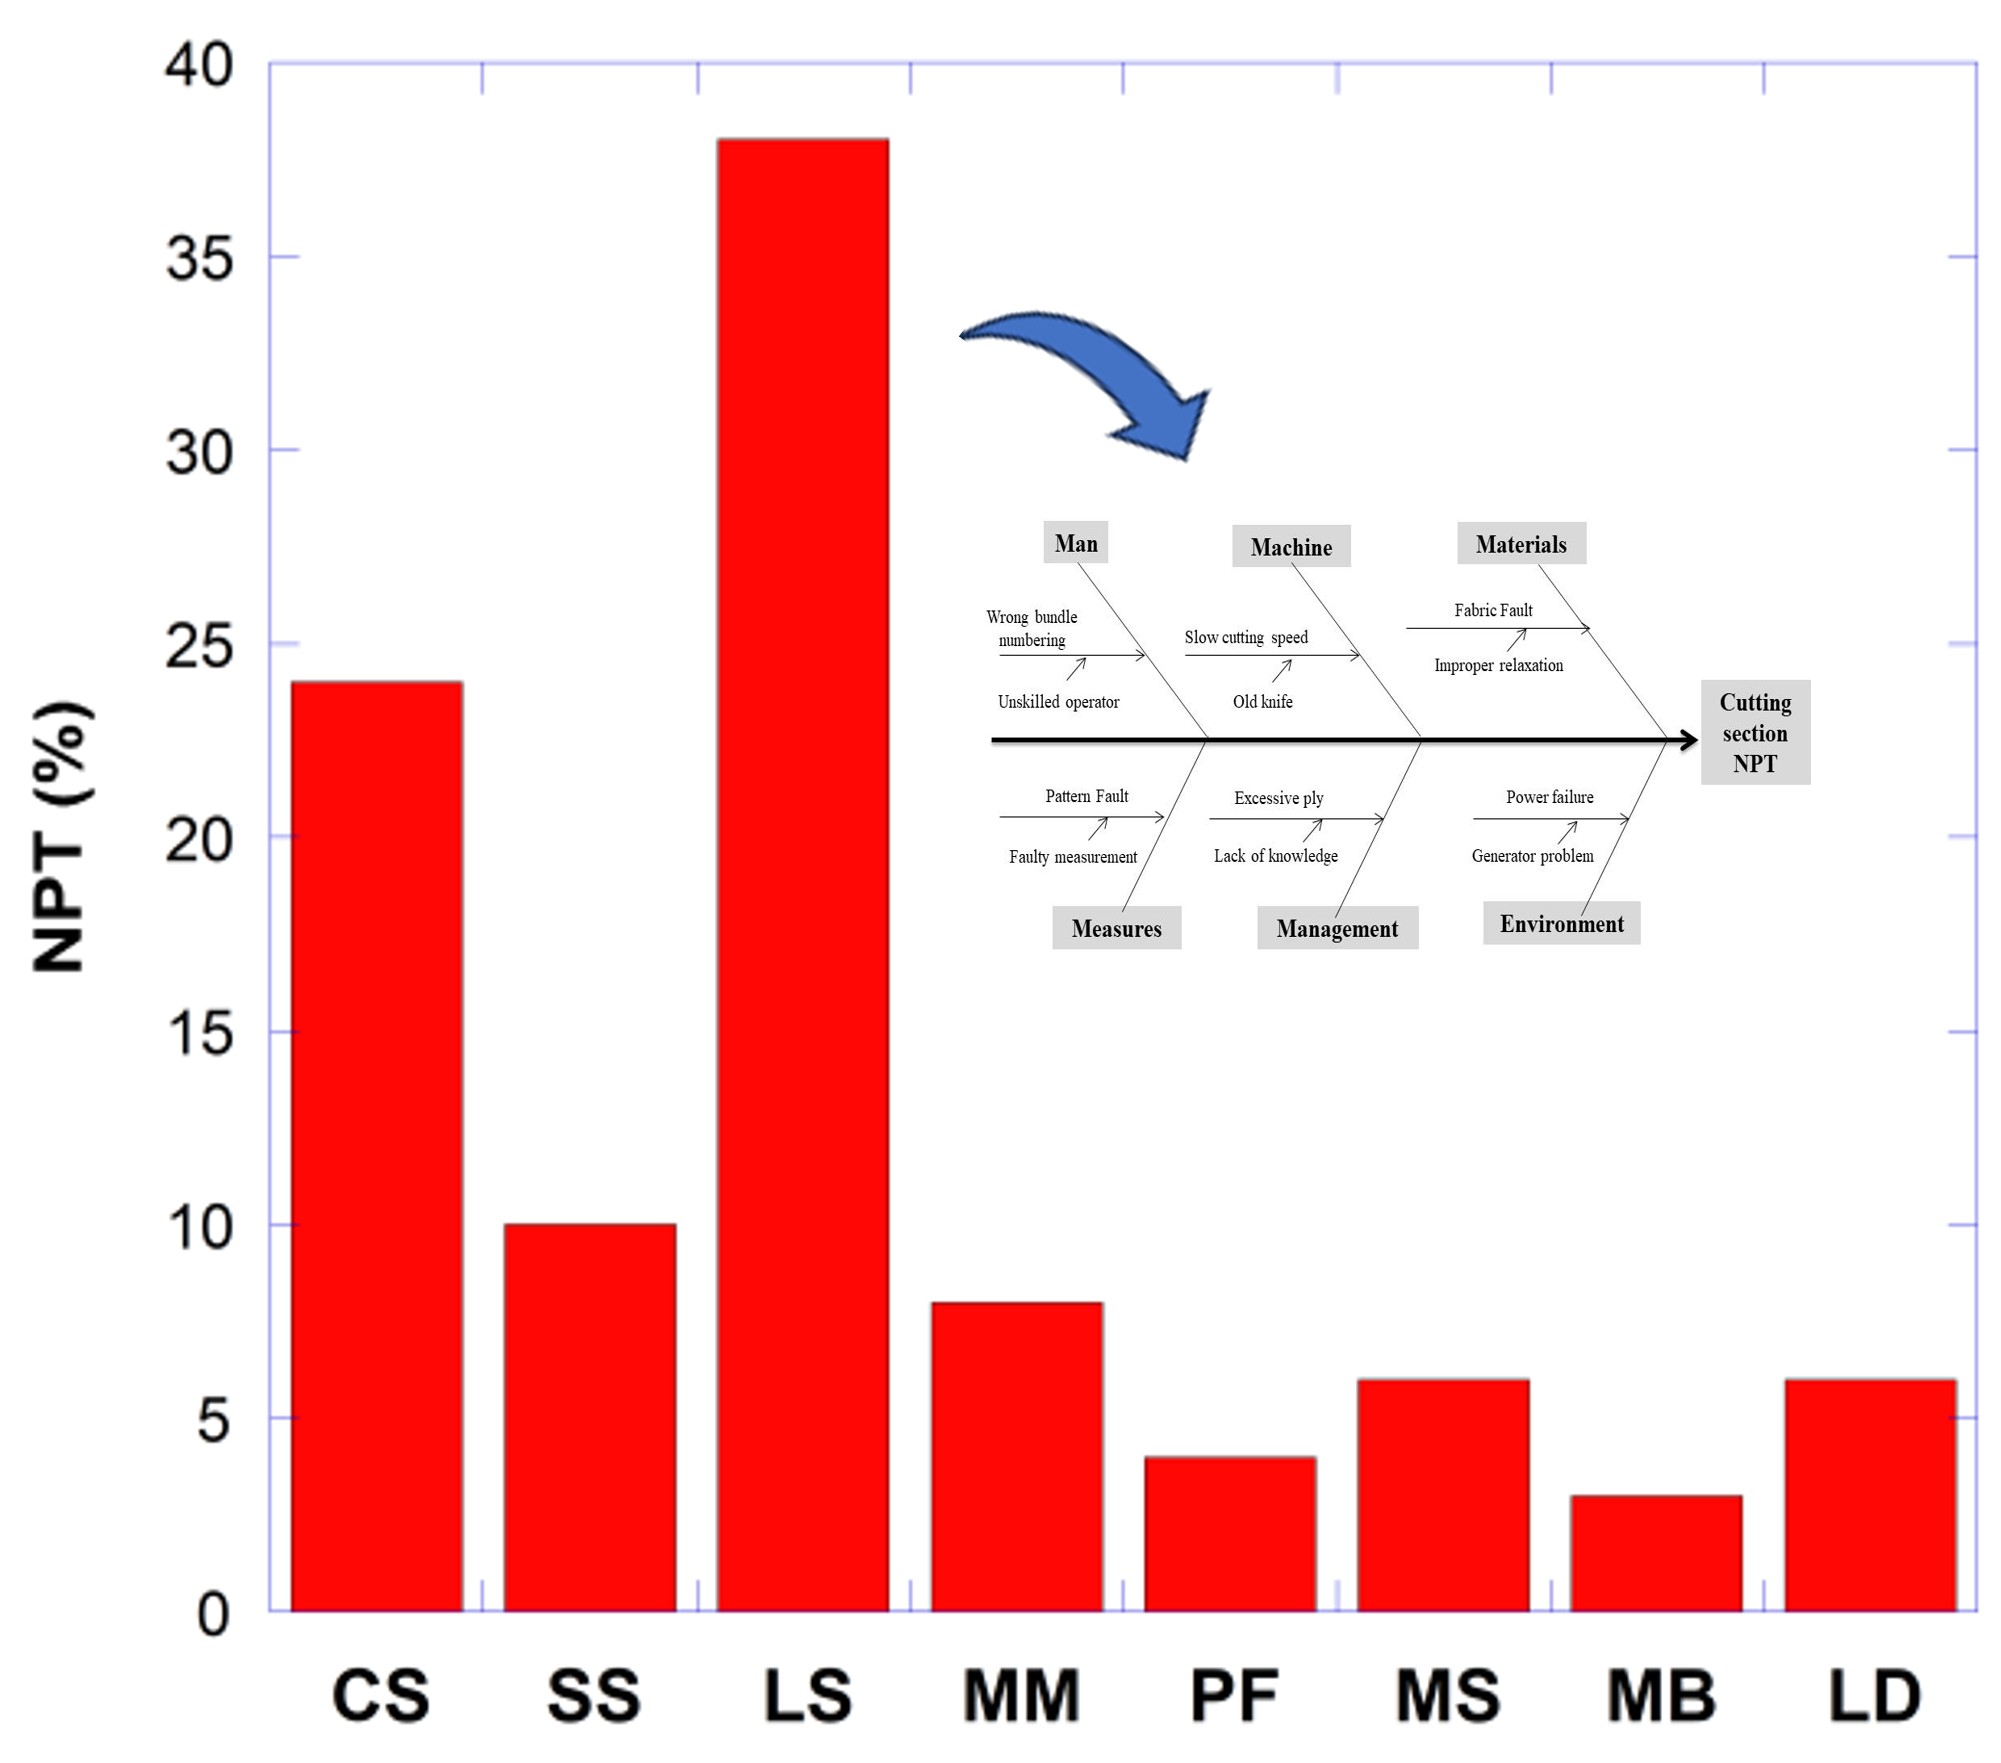
Figure 2. Cause-wise Non-productive time (NPT): (a) total NPT in minutes over two weeks of study; (b) percentage-wise NPT. CS: cutting section, SS: sewing section, LS: line settings, MM: machine maintenance, PF: power failure, MS: material shortage, MB: machine breakdown, and LD: labor delay.
The cutting section and sewing section had some minor stoppage and idling, which are denoted as CS and SS. The minor stoppages (CS and SS) mostly include some minor delay in cutting sections, thread breakages in sewing, and other avoidable causes. It can be seen from Figure 1 that minor stoppages in the cutting section were higher than those in the sewing section. About 34% of the losses were due to minor losses, of which 24% were for the cutting section (CS) and 10% were for the sewing section (SS).
The highest losses were found to be 37.91% in the sewing section due to the line settings (LS) for various adjustments during the production time and especially at the initial settings of the line before the introduction of the style to be manufactured. When a new style needs to be introduced for the first time in a sewing line, LS consumes a lot of time. For a line setting, internal and external activities are essential. These activities cannot be fully eliminated but can be minimized or reduced to a minimum level.
The power failure (PF) loss was 4.33% due to the sudden failure of the power generator. Another important non-productive time (NPT) was material shortage, which is also due to the poor management of material handling and inventory shortage. The material shortage (MS) accounted for 6.50% of the total NPT. Machine breakdown in the sewing section is a common issue for NPT, which was 3.25 %. This breakdown indicates poor schedule machine maintenance. In general, if schedule maintenance of the machine is carried out properly, then breakdown of the machine can be maintained to a minimum.
Labor delay (LD) is the loss for the personal time and other delays during the production time, and it was 5.78%. Labor personal time refers to the time workers spend on personal activities such as taking breaks, restroom visits, or attending to personal matters during work hours. Excessive personal time contributes to a loss in productivity. This delay can be monitored by the production supervisors and can be minimized. Workers also need to be trained and motivated for their personal time. Laborers claimed that they cannot meet the standard time for their personal time because of the shortage of facilities in the section with respect to the number of laborers.
Pareto analysis was employed for the various causes of NPT. According to the Pareto analysis, 80% of losses occur for 20% of phenomena or reasons. If these 20% reasons can be addressed, then 80% losses can be possible to overcome. Based on the Pareto principle, minor stoppages of CS and SS, LS and MM, were the targets to take necessary action against them to minimize their occurrences.
A discussion session with the management of the apparel factory was arranged to visualize these NPTs of the production. Accordingly, management advised preparing a root-cause analysis for each NPT. To achieve the objectives of this study, a systematic procedure was adopted from past studies. A fishbone diagram was employed to find out the basic causes of the NPT. Why? Because logical analysis (WWBLA) work-sheet was used to find out the root causes, which aimed to reduce the future losses.
Table 3 gives the WWBLA worksheet for the minor stoppage type NPT of the cutting section. The countermeasures applied is shown in the WWBLA worksheet. The fishbone diagram is presented in Figure 3, which is constructed based on the WWBLA for the total NPT of the cutting section. The reasons are grouped by man, machine, materials, measures, management, and environment.
Table 3. WWBLA worksheet for total minor stoppage type of NPT in the cutting section
|
1st factor for phenomenon |
2nd factor for phenomenon |
3rd factor for phenomenon |
Countermeasure |
|
1. Thread breakage |
1.1 Poor quality thread |
|
Thread was replaced |
|
2. Bottle neck |
2.1 Unskilled operator |
|
Training was given |
|
3. Layout Problem |
3.1 Wrong Decision |
3.2 Lack of knowledge |
Layout was modified |
|
4. Poor line balancing |
4.1 Wrong method |
3.2 Lack of knowledge |
Training was given |
|
5. Sewing defects |
5.1 Mechanical problem |
5.2 Wrong machine settings |
Settings was corrected |
|
5. Machine Breakdown |
5.1 Mechanical problem |
Poor machine maintenance |
Maintenance schedule was changed |

Figure 3. Fishbone diagram for total minor stoppage type NPT in the cutting section
From the fishbone diagram shown in Figure 3, it can be seen that wrong bundle numbering occurred due to the unskilled operator. Cutting speed was slow because of the old knife. A fabric fault was observed due to improper relaxation. Pattern faults happened as a result of faulty measurement. Excessive ply was due to the lack of know-how. The power failure was due to the breakdown of the power generator. Proper countermeasures were taken to fix the problem by having a discussion with the management of the apparel factory.
Table 4 illustrates the WWBLA worksheet for the total NPT of the sewing section. The countermeasures were applied according to the WWBLA worksheet. The fishbone diagram is displayed in Figure 4, which is constructed based on the WWBLA for the total NPT of the sewing section.
Table 4. WWBLA worksheet for the total minor stoppage type of NPT in the sewing section
|
1st factor for phenomenon |
2nd factor for phenomenon |
3rd factor for phenomenon |
Countermeasure |
|
1. Faulty Fabric |
1.1 Improper relaxation |
|
Relaxation times was controlled |
|
2. Excessive ply |
2.1 Lack of knowledge |
|
Ply level was controlled |
|
3. Faulty pattern |
3.1 wrong measurement |
3.2 unskilled operator |
Pattern was corrected and training was given |
|
4. Slow cutting speed |
4.1 Cutting blade problem |
|
Cutting blade was replaced |
|
5. Wrong bundle number |
5.1 Unskilled operator |
|
Bundle number was corrected and checking system was developed |

Figure 4. Fishbone diagram for total minor stoppage type NPT in the cutting section
The reasons are grouped based on the man, machine, materials, measures, management, and environment. The bottleneck happened due to the unskilled operator setting the line supervisor. Poor line balancing and layout were due to the wrong planning and method employed for that. Excessive end breakage was due to the poor thread quality. Power failure and poor lighting also affected the NPT of the sewing section. Necessary countermeasures were taken to minimize the phenomenon.
After taking necessary action against each phenomenon, the performance of the cutting and sewing section was measured in terms of target production per hour and standard minute value (SMV). Table 5 and Figure 5 show the changes in SMV without NPT and with NPT in the sewing section.
Table 5: Changes in SMV with NPT and without NPT for three garments in the sewing section
|
Item |
SMV (With NPT) |
SMV (without NPT) |
Difference
|
Improvement (%) |
|
T-Shirt |
7.84 |
7.25 |
0.59 |
7.53 |
|
Polo-Shirt |
15.71 |
14.58 |
1.13 |
7.19 |
|
Hoodie |
14.60 |
13.37 |
1.23 |
8.42 |

Figure 5. Reduction of SMV of the sewing section with NPT and without NPT for three different styles
The SMV increased 7.53%, 7.19%, and 8.42% for T-shirts, polo shirts, and hoodies, respectively. Again, the column chart of Figure 6 displays the target and actual production for three different styles, both with NPT and without NPT.

Figure 6. Improvement of production per hour (piece) of the sewing section with NPT and without NPT for three different styles
It shows that the target for the t-shirt increased to 10 pieces when NPT is excluded, while for the polo shirt it went up to 8 pieces, and for the hoodie, it reached 12 pieces (Table 6). The actual production increased 6.67%, 7.27%, and 10% for T-shirts, polo shirts, and hoodies, respectively. The more improvement in the case of the hoodie is attributed to the skills of the operator. Though the T-shirt is the basic garment and comparatively less complex operations are in it, due to some unknown reason the improvement was less than for other garments.
Table 6: Changes in target production per hour with NPT and without NPT
|
Item |
Production (pcs) (with NPT) |
Production (pcs) (without NPT) |
Difference |
Improvement (%) |
|
T-Shirt |
150 |
160 |
10 |
6.67 |
|
Polo-Shirt |
110 |
118 |
8 |
7.27 |
|
Hoodie |
120 |
132 |
12 |
10 |
4. CONCLUSIONS
REFERENCES
[1] Karthik, T., Ganesan, P., & Gopalakrishnan, D. (2016). Apparel manufacturing technology. CRC Press.
[2] Bristi, U., & Al-Mamun, M. (2019). Productivity improvement of cutting and sewing section by implementation of value steam method in a garments industry. American Scientific Research Journal for Engineering, Technology, and Sciences, 54(1), 185-202.
[3] Alam, F. B., & Hasan, M. M. (2018). Analysis on SMV to increase productivity in sewing section: a case study on T-shirt manufacturing in Bangladesh. International Journal of Research in Engineering and Science (IJRES), 6(08), 18-24.
[4] Fatima, A., & Tufail, M. (2023). Improving efficiency of apparel manufacturing through the principles of resource management. Clothing and Textiles Research Journal, 41(3), 225-235.
[5] Rai, S. S., Das, D., Ganguly, K., Giri, S., & Mishra, S. K. (2021). Stage-wise responsiveness in supply chain: reference from the Indian garment industry. International Journal of Logistics Systems and Management, 39(4), 409-436.
[6] Arnob, S. H., Atik, R. I., Ahmed, M. A., & Hassan, S. M. (2020). Lead time optimization of rmg sector supply chain in Bangladesh. Supply Chain Insider| ISSN: 2617-7420 (Print), 2617-7420 (Online), 4(1).
[7] Jain, S., Chandurkar, P., & Upasani, H. (2015). To Reduce Non-Productive Time in Garment Industry. International Journal on Textile Engineering and Processes (IJTEP-2015).
[8] Legesse, D. A., & Singh, A. P. (2014). Productivity improvement through lean manufacturing tools: a case study on Ethiopian garment industry. Int. J. Eng. Res. Technol, 3(9), 1037-1045.
[9] Islam, M. A., Rashed, C. A. A., & Hasan, J. (2017). Productivity improvement through the application of systematic layout planning. Review of General Management, 25(1), 38-54.
[10] Teshome, M. M., Meles, T. Y., & Yang, C. L. (2024). Wickramasekara, A. N., & Perera, H. S. C. (2016). An improved approach to line balancing for garment manufacturing. Journal of Business Research and Insights, 2(1).Heliyon, 10(1).
[11] Manaye, M. (2019). Line balancing techniques for productivity improvement. International Journal of Mechanical and Industrial Technology, 7(1), 89-104.
[12] Wickramasekara, A. N., & Perera, H. S. C. (2016). An improved approach to line balancing for garment manufacturing. Journal of Business Research and Insights 2(1).
[13] Jadhav, S. S., Sharma, G. S., Daberao, A. M., & Gulhane, S. S. (2017). Improving productivity of garment industry with time study. International Journal on Textile Engineering and Processes, 3(3), 1-6.
[14] Moin, C. J., Iqbal, E. M., & Ali, M. (2017). Assessment of labor skill and development of labor skill matrix for sewing section of an apparel industry. In International Conference on Mechanical Engineering and Renewable Energy 2017.
[15] Iqbal, M., Ali, M., Haque, R., & Moin, C. J. (2018). Performance variation with time of apparel sewing workers: a case study. Eur. Sci. J, 14, 485-498.
[16] Moin, C. J., Doulah, A. S. U., Ali, M., & Sarwar, F. (2018). Implementation of an operating procedure for quality control at production level in a RMG industry and assessment of quality improvement. The Journal of The Textile Institute, 109(4), 524-535.
[17] Wickramasinghe, G. L. D., & Perera, A. (2016). Effect of total productive maintenance practices on manufacturing performance: Investigation of textile and apparel manufacturing firms. Journal of Manufacturing Technology Management, 27(5), 713-729.
[18] Hamja, A., Maalouf, M., & Hasle, P. (2019). Assessing the effects of lean on occupational health and safety in the Ready-Made Garment industry. Work, 64(2), 385-395.
[19] Hossen, J. (2016). Improvement of overall equipment efficiency (OEE) of ring frame section of a spinning mill a case study.
[20] Jilcha, K., Tigabie, M., Mulugeta, K., & Asrat, H. (2019). The impact of quality control tools application on supply chain management: a case of wossi garment factory. J Textile Sci Eng, 9(401), 2.


Georgia Reader Reply
Et rerum totam nisi. Molestiae vel quam dolorum vel voluptatem et et. Est ad aut sapiente quis molestiae est qui cum soluta. Vero aut rerum vel. Rerum quos laboriosam placeat ex qui. Sint qui facilis et.