Optimization of Nozzle Air Pressure for Enhanced Quality and Efficiency in CVC Yarn Production using Murata Vortex Spinning
Abstract
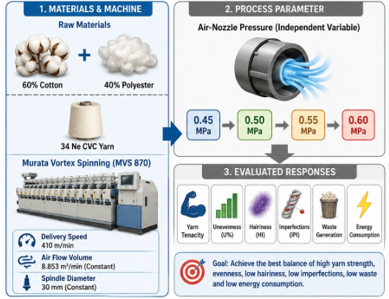
This study investigates the effect of air-nozzle pressure on the quality and production efficiency of 34 Ne CVC yarn composed of 60% cotton and 40% polyester, produced using a Murata Vortex Spinning 870 system. Four nozzle pressure levels, namely 0.45, 0.50, 0.55, and 0.60 MPa, were evaluated to determine their influence on yarn count, unevenness, tensile strength, hairiness, imperfections, waste generation, and energy consumption. The results show that nozzle pressure considerably affects yarn quality and operational performance. Among the tested pressure levels, 0.50 MPa produced the highest tenacity of 15.72 cN/tex and the lowest yarn unevenness of 10.25%, indicating superior yarn strength and regularity. Increasing the pressure further improved hairiness, with the hairiness index decreasing from 648 S3u/100 m at 0.45 MPa to 435 S3u/100 m at 0.60 MPa. However, higher pressure also increased total imperfections, mass variation, waste generation, and specific energy consumption. Total wastage increased from 3.10% at 0.45 MPa to 3.95% at 0.60 MPa, while specific energy consumption increased from 2.15 to 2.45 kWh/kg. Although 0.60 MPa produced smoother yarn, it resulted in higher imperfections, lower tenacity, reduced elongation, and greater energy demand. The production rate remained unchanged across all pressure levels, indicating that nozzle pressure mainly influenced quality and efficiency rather than output quantity. Overall, 0.50 MPa was identified as the optimum air-nozzle pressure for achieving a balanced combination of yarn strength, evenness, surface quality, waste control, and energy efficiency in 34 Ne CVC vortex-spun yarn production. This research provides valuable insights for optimizing pneumatic parameters in MVS, offering textile manufacturers a data-driven framework for improving yarn quality while balancing energy efficiency and production costs.
Full Text
1.0 Introduction
Spinning is the process of converting loose fibers into a continuous strand called yarn by drawing out and twisting the fibers together. It is a fundamental step in textile manufacturing that determines the strength, uniformity, and quality of the final yarn. Different spinning methods, such as ring, rotor, and vortex spinning are used depending on the desired yarn properties and production efficiency [1].
Murata Vortex Spinning (MVS) is a high-speed, unconventional yarn manufacturing technology developed by Murata Machinery (Muratec) that uses high-velocity compressed air to twist fibers into yarn. It skips intermediate steps like roving and delivers finished yarn directly from drafted sliver at high speed. The MVS system uses a specialized air-jet nozzle and hollow stationary spindle system to create a "true" twist without any mechanically moving parts. A highly uniform fiber sliver is fed into a 4-roller drafting system, where it is elongated and attenuated into a thin, parallel strand. The drafted fibers enter a spinning chamber equipped with injectors that generate a powerfully swirling, high-speed compressed air vortex. As the fibers pass through, the leading ends of the fibers are guided into a hollow spindle, while the free, trailing ends are caught by the swirling airflow, splaying outwardly. The outwardly splayed fibers are inverted at the tip of the hollow spindle and wrapped helically around the straight, untwisted core fibers inside. A vacuum at the base of the spindle vacuums away excess short fibers and waste, leaving an "air-combed," two-part yarn structure. Delivery rollers continuously draw out the finished, wrapped yarn to be wound directly onto packages [2]. Yarn formation mechanism within the vortex spinning are shown in figure 1.

Figure 1: Schematic illustration of the yarn formation mechanism within the vortex spinning chamber, demonstrating how the high-velocity rotational airflow twists the fiber strand [2].
CVC yarn, a blend of 60% cotton and 40% polyester, has become a staple in the textile industry due to its superior fabric performance. Cotton contributes to softness, breathability, and comfort, while polyester enhances strength, durability, and moisture-wicking properties. This balance makes CVC yarn ideal for producing knitted fabrics used in polo shirts, t-shirts, and other apparel, where both comfort and strength are essential. However, the blending of these fibers with different mechanical properties poses challenges in vortex spinning, especially when using high-speed airflows that require precise control [3].
The air-nozzle pressure in vortex spinning is a critical parameter that directly affects the quality of the produced yarn. It is the driving force behind the aerodynamic vortex that twists the fibers and determines the yarn's strength, evenness, and surface properties. Increased nozzle pressure intensifies the vortex action, leading to tighter fiber wrapping and, in some cases, higher tenacity. However, excessive nozzle pressure can cause pneumatic turbulence, where the airflow becomes too aggressive, resulting in fiber displacement, increased imperfections, and reduced structural integrity. The challenge is to identify the pressure level that balances the increase in wrapping torque with the minimization of fiber damage caused by excessive airflow. Therefore, finding the optimal nozzle pressure for specific yarn types is essential for cost-effective production without compromising quality [4].
Soe et al. (2004) studied the structure and properties of Murata vortex spun yarns and compared them with ring and open-end rotor spun yarns. Their findings revealed that the MVS yarn exhibited superior tenacity and lower hairiness compared to rotor-spun yarns, despite having a more irregular structure. The study highlighted the significant influence of airflow dynamics within the MVS nozzle, which affects fiber orientation and wrapping [5]. Tusief et al. studied the impact of various process variables on the tensile properties of Polyester/Cotton (P/C) blended yarn produced using MVS. The study found that blend ratios, spindle diameter, and distance between the front roll and spindle significantly influenced yarn strength and elongation. They recommended optimizing these variables to improve yarn quality [6]. Ortlek examined the effects of delivery speed, nozzle pressure, and yarn count on the properties of 100% cotton vortex spun yarns. The results showed that increased nozzle pressure improved yarn tenacity and reduced hairiness. However, the study also emphasized that nozzle pressure significantly impacts yarn unevenness, with a moderate pressure yielding optimal yarn properties [7]. Basal and Oxenham focused on the structural and mechanical differences between vortex spun yarns and air-jet spun yarns. They concluded that vortex yarns, especially at higher cotton contents, offer better tenacity but with higher hairiness. Their research showed that increasing nozzle pressure decreases hairiness and improves yarn uniformity, suggesting that nozzle pressure is a critical factor in quality optimization A[8]. Repon et al. investigated CVC yarns spun using the MVS system and examined the effects of drafting ratios. They found that increased draft ratios enhanced the uniformity and strength of the yarn. However, the study noted that further optimization of drafting and air pressure parameters is needed to achieve high-quality CVC yarns [9]. Pei and Yu modeled the fiber motion inside the MVS nozzle using computational fluid dynamics (CFD). Their numerical simulations showed that higher nozzle pressures improve yarn tenacity by better fiber entanglement within the nozzle. The study also concluded that yarn delivery speed has a negative impact on tenacity, especially at higher delivery speeds [10]. Yali et al. studied the effect of delivery speed and nozzle air pressure on viscose yarns. They found that higher nozzle pressure increases yarn tenacity but has minimal impact on yarn irregularity. The research suggested that optimizing nozzle pressure is crucial for producing high-strength viscose yarns, although speed had less effect on tenacity [4]. Karakan Günaydin and Soydan provided a detailed overview of the MVS system and its impact on yarn structure. They highlighted how nozzle pressure and spindle diameter affect the tenacity and hairiness of the yarn. Their research suggested that higher nozzle pressures lead to stronger yarns with a more ring-spun-like structure, making it an ideal option for high-performance yarn production [11]. Tripathi et al. conducted an experiment using the Box-Behnken design to optimize the spindle diameter, nozzle pressure, and delivery speed for polyester/cotton blended yarns. Their results showed that nozzle pressure positively influenced yarn tenacity but caused a reduction in yarn hairiness. They suggested that an optimal combination of these factors is necessary for producing high-quality vortex yarn [12]. Dutta et al. explored the impact of nozzle air pressure on CVC vortex spun yarns. Their study concluded that increased nozzle pressure improved yarn tenacity and reduced hairiness, but higher pressures also led to an increase in cost due to the additional energy required for higher pressure settings. They recommended a standard spindle air pressure of 0.50 MPa for optimal quality and cost balance [13]. While significant research has been conducted on the effects of nozzle pressure in MVS, most studies have focused on coarse yarns or 100% cotton blends, leaving a notable gap in understanding the influence of nozzle pressure on fine-count CVC yarns (60% cotton / 40% polyester). Additionally, while previous work has highlighted the impact of nozzle pressure on yarn tenacity, hairiness, and imperfections, the synergistic effects of fiber blend composition and nozzle pressure in fine-count yarns remain underexplored. Furthermore, the economic implications of higher nozzle pressures, such as energy consumption and waste generation, have not been sufficiently addressed in the context of industrial-scale vortex spinning.
This study aims to address the existing research gap by providing a comprehensive evaluation of air-nozzle pressure optimization for CVC yarn production using Murata Vortex Spinning. The investigation focuses not only on yarn quality parameters, such as tenacity, unevenness, hairiness, and imperfections, but also on production efficiency indicators, including waste generation and energy consumption. By integrating quality performance with operational and sustainability-related factors, this research presents a holistic approach to nozzle pressure optimization under real industrial manufacturing conditions. The findings are expected to provide textile manufacturers with a practical, data-driven, and cost-effective framework for improving yarn quality while reducing material waste and energy demand in vortex spinning applications.
2. Materials and Methods
2.1 Materials
The raw material used in this study was a chief value cotton (CVC) blend composed of 60% cotton and 40% polyester fiber. This blend was selected due to its widespread use in the production of high-quality knitted fabrics, where cotton provides comfort and breathability, while polyester contributes strength and dimensional stability. The properties of cotton fiber and polyester fiber are shown in table 1 and table 2 respectively. The CVC blend was chosen to investigate the interaction between cotton and polyester fibers under varying pneumatic forces during the vortex spinning process. All fibers used in this study were collected from the running production stock of Square Textiles PLC, Gazipur, Bangladesh.
Table 1: Properties of cotton fibers (HVI report)
|
Sl |
Parameter |
Abbreviation |
Value |
|
1. |
Spinning Consistency Index |
SCI |
130 |
|
2. |
Moisture Content |
Mst (%) |
6.2 |
|
3. |
Micronaire (Fineness) |
Mic |
4.37 |
|
4. |
Maturity Ratio |
Mat [mat1] |
0.88 |
|
5. |
Upper Half Mean Length |
UHML (mm) |
30.62 |
|
6. |
Uniformity Index |
UI (%) |
82.0 |
|
7. |
Short Fiber Index |
SF (%) |
8.7 |
|
8. |
Fiber Strength |
Str (g/tex) |
30.1 |
|
9. |
Elongation |
Elg (%) |
4.0 |
|
10. |
Reflectance |
Rd |
71.3 |
|
11. |
Yellowness |
+b |
11.3 |
|
12. |
Color Grade (Upland) |
C Grd |
25 |
|
13. |
Trash Count |
TrCnt |
0.26 |
Table 2: Properties of polyester fibers
|
Sl |
Characteristic |
Unit |
Value |
|
1. |
Staple Length |
mm |
38 |
|
2. |
Linear Density |
den |
1.50 |
|
3. |
Tenacity |
g/den |
6.20 |
|
4. |
Breaking Extension |
% |
24.0 |
|
5. |
Moisture Regain |
% |
0.5 |
|
6. |
Specific Gravity |
g/cm³ |
1.38 |
|
7. |
Melting Point |
°C |
250 |
|
8. |
Hot Air Shrinkage |
% |
5.0 (at 180°C) |
|
9. |
Lustre |
Semi-Dull |
|
2.2 Spinning Process
The production of all yarn samples was executed on an industrial-scale Murata Vortex Spinning (MVS) 870 machine at Square Textiles PLC, situated in Gazipur, Bangladesh (Figure 2). The experimental machine configuration utilized a setup composed of 96 active spindles, with each spindle operating at a constant, high-speed yarn delivery rate of 410 m/min. To maintain structural stability and preserve consistent fiber path behavior throughout the high-speed pneumatic assembly, the spinning machine was rigorously calibrated before running the trials, ensuring a uniform contact pressure of 2.2 bar across the system.
The pre-spinning material preparation stage utilized a finished drawing sliver consisting of a 60% cotton and 40% polyester chief value cotton (CVC) blend. This feed drawing sliver was introduced into the spinning process with a predetermined linear density of 60 grains/yard. To systematically attenuate this thick fiber strand down to the targeted fine yarn count of 34 Ne, the MVS machine’s specialized 4-roller drafting layout was systematically adjusted to a comprehensive Total Draft Ratio (TDR) of 230.
The distribution of the drafting forces was configured by assigning a Break Draft Ratio (BDR) of 3.5 within the back drafting zone, while the Middle Draft Ratio (MDR) was set to 35.0 within the middle drafting zone. To fulfill the total structural attenuation requirements of the system, the front zone draft was calculated to operate at an exact ratio of 1.88. Furthermore, the specialized machine zone settings (representing structural element clearances and mechanical cradle openings rather than direct nip-to-nip roller field distances) were maintained at a standard configuration denoted as 4 ×5 ×C1. In this physical setup, the clearance between the middle roller and the third roller components was set to 4 mm, the clearance between the third roller and the fourth roller components was fixed at 5 mm, and the front delivery zone incorporated a standard C1 collector guide arrangement.
Following the mechanical drafting and core fiber attenuation stages, the pneumatic manipulation of the yarn properties was executed by varying the air-nozzle pressure across four distinct industrial operational baselines: 0.45 MPa, 0.50 MPa, 0.55 MPa, and 0.60 MPa. These exact pneumatic intervals were selected to evaluate the correlation between vortex airflow dynamics and subsequent yarn parameters, including hairiness, mass unevenness, and tensile properties. All variations in the nozzle air pressure were carried out independently while locking the mechanical delivery speed at a constant 410 m/min, thereby successfully isolating the specific influence of pneumatic pressure variations on the overall quality and structural behavior of the spun CVC vortex yarn.

Figure 2: Yarn formation zone of vortex spinning (MVS)
2.3 Experimental Design
A total of four trial phases were conducted to investigate the influence of varying air-nozzle pressures on the physical and mechanical properties of the yarn. Each trial was carried out continuously for 24 hours, covering three 8-hour shifts, and 10 bobbins were collected from each trial for detailed analysis. In trial 1, a nozzle pressure of 0.45 MPa was applied to evaluate the effect of lower pneumatic pressure on yarn quality. Trial 2 was performed at 0.50 MPa to establish the industrial baseline for yarn properties. Trial 3, conducted at 0.55 MPa, aimed to identify the optimal pressure for improving yarn strength and surface smoothness. Finally, Trial 4 was carried out at 0.60 MPa to assess the effects of over-pressurization and the associated risks on yarn quality. Overall process flowchart used in this study is shown in figure 3.

Figure 3: Methodological flowchart used in the study
2.4 Sample Conditioning
To ensure accurate and reliable testing, all yarn samples were conditioned in a controlled environment at 20°C ± 2°C and 65% ± 2% relative humidity for 48 hours as per ISO 139 standards before any measurements were taken. This conditioning period allowed for moisture equilibrium, ensuring that variations in yarn properties due to environmental factors were minimized.
2.5 Testing Procedures
2.5.1 Yarn Evenness and Imperfections
The yarn evenness, mass variation, and imperfections (IPI) were evaluated using the Uster Tester 6 (UT-6). This capacitive testing instrument provides detailed characterization of yarn irregularities, including thin places, thick places, neps, and hairiness. The measured parameters included mass variation (CVm%), total imperfections (IPI) comprising thin, thick, and neps, as well as the hairiness index (H) and S3u, which represents the number of protruding fibers longer than 3 mm. Each yarn sample was tested for a duration of 2.5 minutes, and all measurements were conducted at a testing speed of 400 m/min to ensure consistency and reliability of the results.
2.5.2 Tensile Strength and Elongation
The tensile properties of the yarn samples were evaluated using the MesdanLab Strength Tester (Autodyn II). This instrument was used to determine key mechanical parameters, including breaking force (cN), tenacity expressed as RKM (cN/tex), and elongation at break (%). Each yarn specimen was tested under controlled conditions with a gauge length of 500 mm and a constant elongation rate of 5000 mm/min. A pre-tension of 0.5 cN/tex was applied to ensure proper alignment and consistency during testing. The measurements obtained provided a reliable assessment of the strength and extensibility characteristics of the yarn.
2.5.3 Waste Measurement
Waste (short fibers, lint, and micro-dust) was collected from the suction system of the MVS machine. The total waste was calculated by weighing the collected material, and the waste percentage was determined relative to the total yarn produced.
2.7 Energy Consumption Analysis
Energy consumption for each trial was estimated based on the power usage of the MVS 870 machine and the associated pneumatic requirements. The Specific Energy Consumption (SEC), which represents the energy used per kilogram of yarn produced, was calculated for each nozzle pressure setting. The power consumption of the machine and air compressor was recorded for each trial, and the total energy used was analyzed in relation to the yarn production efficiency.
3. Results and Discussion
3.1 Influence of Nozzle Pressure on Yarn Count, Unevenness, and Mass Variation
Table 3 presents the effect of different air-nozzle pressures on the actual yarn count, yarn unevenness, and mass variation of 34 Ne CVC yarn produced by MVS. The actual yarn count showed a slight increasing trend with the increase in nozzle pressure. The count increased from 33.65 Ne at 0.45 MPa to 34.00 Ne at 0.60 MPa, indicating that higher air pressure helped the yarn approach the nominal count more closely. However, the overall variation in count was small, suggesting that nozzle pressure had only a limited effect on yarn count accuracy within the tested pressure range.
Yarn unevenness, expressed as U%, showed a different trend. The lowest unevenness value was observed at 0.50 MPa, where U% decreased to 10.25% compared with 10.42% at 0.45 MPa. This indicates that moderate nozzle pressure improved fiber control and yarn regularity during vortex yarn formation. However, further increase in pressure resulted in higher unevenness, with U% increasing to 10.32% at 0.55 MPa and 10.48% at 0.60 MPa. This suggests that excessive air pressure may disturb the fiber arrangement inside the spinning zone, leading to reduced yarn uniformity.
Table 3. Effect of air-nozzle pressure on yarn count, unevenness, and mass variation
|
Sl |
Air Pressure (MPa) |
Actual Count (Ne) |
Yarn Unevenness (U%) |
Mass Variation (CVm%) |
|
1 |
0.45 |
33.65 |
10.42 |
12.15 |
|
2 |
0.50 |
33.71 |
10.25 |
12.94 |
|
3 |
0.55 |
33.78 |
10.32 |
13.06 |
|
4 |
0.60 |
34 |
10.48 |
13.22 |
Mass variation, measured as CVm%, increased gradually with increasing nozzle pressure. The lowest CVm% was recorded at 0.45 MPa, with a value of 12.15%, while the highest value was found at 0.60 MPa, reaching 13.22%. This continuous increase indicates that higher nozzle pressure may create greater instability in mass distribution along the yarn length. Although higher pressure can improve fiber wrapping and surface compactness, excessive air turbulence may also disturb fiber flow and increase mass irregularity.
These above results indicate that 0.50 MPa provides the most favorable balance for yarn regularity, as it produced the lowest U% and maintained a count close to the target 34 Ne. Although 0.45 MPa gave the lowest CVm%, it showed slightly higher unevenness and a lower actual count. Therefore, considering count accuracy and yarn unevenness together, 0.50 MPa can be considered the most suitable nozzle pressure for improving yarn regularity in this section of the study.
3.2 Influence of Nozzle Pressure on Tensile Properties of CVC Yarn
Figure 4 illustrates the influence of air-nozzle pressure on the tensile properties of 34 Ne CVC yarn, including tenacity, elongation, strength CV%, and Count Lea Strength Product (CLSP). The results indicate that the tensile behaviour of vortex-spun CVC yarn was noticeably affected by the change in nozzle pressure.
As shown in Figure 4(a), yarn tenacity initially increased with increasing air pressure from 0.45 MPa to 0.50 MPa. The tenacity improved from 15.18 cN/tex at 0.45 MPa to the maximum value of 15.72 cN/tex at 0.50 MPa. This improvement may be attributed to better fiber wrapping and improved yarn consolidation at moderate air pressure. However, further increase in pressure caused a reduction in tenacity, decreasing to 15.46 cN/tex at 0.55 MPa and 15.32 cN/tex at 0.60 MPa. This suggests that excessive air pressure may disturb fiber arrangement in the spinning zone and reduce the structural balance of the yarn.
Figure 4(b) shows that elongation decreased continuously with increasing nozzle pressure. The highest elongation was found at 0.45 MPa, with a value of 5.48%, while the lowest value was recorded at 0.60 MPa, with 4.42%. This decreasing trend indicates that higher air pressure produced a more compact and tightly wrapped yarn structure, which reduced the yarn’s ability to extend before breakage. Therefore, although higher pressure may improve yarn compactness, it can also reduce yarn flexibility.

Figure 4. Effect of air-nozzle pressure on tensile properties of CVC yarn: (a) tenacity, (b) elongation, (c) strength CV%, and (d) CLSP.
Figure 4(c) presents the variation in strength CV%. Strength CV% increased from 0.38% at 0.45 MPa to 0.82% at 0.60 MPa. Since lower CV% indicates better consistency in yarn strength, the increasing trend shows that higher nozzle pressure reduced strength uniformity. This may be due to irregular fiber wrapping and uneven stress distribution caused by excessive air turbulence at higher pressure levels.
In contrast, Figure 4(d) shows a continuous increase in CLSP with increasing air-nozzle pressure. CLSP increased from 2295 at 0.45 MPa to 2390 at 0.60 MPa. This indicates that higher pressure contributed to improved lea strength performance. However, this improvement should be interpreted carefully because individual yarn tenacity and elongation decreased beyond 0.50 MPa, while strength variation increased. Therefore, a higher CLSP value at 0.60 MPa does not necessarily represent the best overall tensile performance. The steady inflation of macro CLSP up to 0.60 MPa, despite the decay in single-yarn tenacity, can be attributed to the significantly reduced hairiness index at maximum pressure. The highly compact structure and fewer protruding fibers mitigate inter-strand slippage and frictional resistance within the lea testing loop, artificially elevating the cumulative bundle resistance even though localized core structural damage exists
Overall, the figure indicates that 0.50 MPa is the most suitable nozzle pressure for tensile performance, as it produced the highest tenacity while maintaining acceptable elongation and strength variation. Although 0.45 MPa showed the highest elongation and lowest strength CV%, its tenacity was lower. Similarly, 0.60 MPa produced the highest CLSP but resulted in lower tenacity, lower elongation, and higher strength variability. Therefore, considering tenacity, elongation, strength consistency, and CLSP together, 0.50 MPa provided the best balanced tensile performance among the tested pressure levels.
3.3 Influence of Nozzle Pressure on Yarn Imperfections
The Total Imperfection Index (IPI), which represents the cumulative sum of thin places, thick places, and neps per kilometer of yarn, is a critical quality indicator that directly dictates downstream weaving and knitting efficiency. The absolute breakdown of these localized mass variations across the four experimental air-nozzle pressures is compiled in Table 4.
Table 4: Detailed breakdown of yarn imperfections (IPI) at different nozzle pressures
|
Sl |
Nozzle Air Pressure (MPa) |
Thin Places (−50%/km) |
Thick Places (+50%/km) |
Neps (+200%/km) |
Total IPI (per km) |
|
1 |
0.45 |
65 |
85 |
170 |
320 |
|
2 |
0.50 |
79 |
127 |
205 |
411 |
|
3 |
0.55 |
106 |
195 |
250 |
551 |
|
4 |
0.60 |
136 |
254 |
290 |
680 |
The experimental data reveals that the Total Imperfection Index (IPI) escalated progressively and substantially with the rise in air-nozzle pressure, exhibiting a 112.5% increase from 320 per km at 0.45 MPa to 680 per km at 0.60 MPa. An examination of the individual imperfection categories indicates that as the operating pressure shifted from 0.45 MPa to 0.60 MPa, thin places (-50%/km) rose from 65 to 136, thick places (+50%/km) increased from 85 to 254, and neps (+200%/km) grew from 170 to 290. This systematic deterioration in yarn regularity demonstrates that higher pneumatic pressures exert a destructive influence on the short-range mass distribution of the Chief Value Cotton (CVC) blend.
This rising trend in yarn imperfections is structurally linked to the aerodynamic turbulence generated within the nozzle chamber. In Murata Vortex Spinning, the fiber strand delivered from the front roller nip enters a high-speed swirling air field. While a higher air pressure increases the rotational velocity of the vortex—which enhances fiber wrapping and drastically reduces the hairiness index—it simultaneously introduces high-velocity air eddies near the inlet of the hollow spindle. This intense aerodynamic turbulence disturbs the stable, parallel arrangement of the drafted fiber stream as it exits the front drafting rollers. The resulting chaotic fiber migration causes localized bunching and uncontrolled clustering of the fibers, which directly manifests as a sharp rise in both thick places (+50\%/km) and micro-neps (+200%/km). Consequently, the neighboring segments of the fiber stream are depleted of their necessary fiber volume, which systematically increases the incidence of thin places (-50%/km).
Although the lowest air pressure of 0.45 MPa yielded the lowest overall imperfection level of 320 per km, this setting proved unfavorable because it lacked the kinetic energy required to firmly wrap the sheath fibers, resulting in lower yarn tenacity and excessive hairiness. In contrast, operating at 0.50 MPa establishes an ideal aerodynamic balance. At this setting, the vortex current is strong enough to achieve optimal fiber wrapping—maximizing tenacity and optimizing mass evenness—while keeping the total imperfections at an industrially acceptable level of 411 per km. Increasing the pressure to 0.55 MPa or 0.60 MPa should be avoided in commercial production, as the excess kinetic energy fails to improve the structural core-sheath alignment and instead accelerates fiber disruption, causing a severe penalty in overall yarn uniformity.
3.4 Influence of Nozzle Pressure on Waste Generation
Table 5 presents the effect of air-nozzle pressure on waste generation during the production of 34 Ne CVC yarn using murata vortex spinning. The results show a clear increasing trend in suction wastage, visible lint, and total wastage with increasing nozzle pressure.
Suction wastage increased from 2.85% at 0.45 MPa to 3.15% at 0.50 MPa, followed by further increases to 3.40% at 0.55 MPa and 3.55% at 0.60 MPa. Similarly, visible lint increased gradually from 0.25% at 0.45 MPa to 0.40% at 0.60 MPa. As a result, total wastage increased from 3.10% at 0.45 MPa to 3.95% at 0.60 MPa, representing an overall increase of 0.85 percentage points across the tested pressure range.
Table 5: Waste Generation at Different Nozzle Pressures
|
Sl |
Nozzle Pressure (MPa) |
Suction Wastage (%) |
Visible Lint (%) |
Total Wastage (%) |
|
1 |
0.45 MPa |
2.85 |
0.25 |
3.10 |
|
2 |
0.50 MPa |
3.15 |
0.30 |
3.45 |
|
3 |
0.55 MPa |
3.40 |
0.35 |
3.75 |
|
4 |
0.60 MPa |
3.55 |
0.40 |
3.95 |
The increase in waste generation at higher nozzle pressures was attributed to the stronger vortex air flow and higher pneumatic force acting on the fiber strand during yarn formation. While increased air pressure can improve fiber wrapping and reduce yarn hairiness, excessive pressure may also remove more short, loose, or weakly bound fibers from the yarn-forming zone. This leads to increased suction waste and visible lint formation.
Among the tested pressure levels, 0.45 MPa produced the lowest total wastage, indicating better fiber retention. However, this pressure did not provide the highest yarn tenacity or the lowest unevenness. In contrast, 0.50 MPa showed a moderate increase in total wastage to 3.45%, but it also produced the best tensile strength and yarn regularity. Therefore, from an optimization perspective, the small increase in waste at 0.50 MPa may be acceptable because it is accompanied by improved yarn quality.
Overall, the waste-generation results indicate that excessive nozzle pressure should be avoided because it increases fiber loss without providing proportional improvement in overall yarn performance. Although 0.60 MPa improved yarn hairiness, it generated the highest total wastage of 3.95%, making it less favorable from a material utilization and production efficiency standpoint. Thus, 0.50 MPa can be considered a more balanced pressure setting, providing improved yarn quality while maintaining waste generation at an acceptable level.
3.5 Influence of Nozzle Pressure on Energy Consumption
Table 6 shows the effect of air-nozzle pressure on power load and specific energy consumption during the production of 34 Ne CVC yarn. In this study, the air flow volume was kept constant at 8.853 m³/min for all nozzle pressure levels. Therefore, the variation in power load and specific energy consumption can be mainly related to the change in air-nozzle pressure.
Table 6. Effect of air-nozzle pressure on power load and specific energy consumption
|
Sl |
Nozzle Air Pressure (MPa) |
Power Load (kW) |
Specific Energy Consumption (kWh/kg) |
|
1 |
0.45 |
17.12 |
2.15 |
|
2 |
0.50 |
18.10 |
2.28 |
|
3 |
0.55 |
18.90 |
2.37 |
|
4 |
0.60 |
19.60 |
2.45 |
The results show that power load increased gradually with increasing nozzle pressure. At 0.45 MPa, the power load was 17.12 kW, which increased to 18.10 kW at 0.50 MPa. Further increases in pressure resulted in higher power load values of 18.90 kW at 0.55 MPa and 19.60 kW at 0.60 MPa. This indicates that higher nozzle pressure required greater energy input during yarn production. A similar increasing trend was observed for specific energy consumption (SEC). The SEC increased from 2.15 kWh/kg at 0.45 MPa to 2.28 kWh/kg at 0.50 MPa. It further increased to 2.37 kWh/kg at 0.55 MPa and reached the highest value of 2.45 kWh/kg at 0.60 MPa. Overall, the increase in nozzle pressure from 0.45 MPa to 0.60 MPa resulted in an increase of 0.30 kWh/kg in SEC.
The increase in energy consumption at higher nozzle pressures attributed to the greater pneumatic force required to maintain yarn formation under stronger air pressure. Although higher pressure improved yarn hairiness by producing a smoother yarn surface, it also increased energy demand. Therefore, excessive nozzle pressure may reduce process efficiency and increase production cost.
From an optimization perspective, 0.50 MPa appears to be the most balanced pressure setting. At this pressure, the SEC was 2.28 kWh/kg, which was only moderately higher than that at 0.45 MPa, while the yarn showed the highest tenacity and lowest unevenness. In contrast, 0.60 MPa resulted in the highest power load and SEC, making it less favorable from an energy-efficiency point of view. Therefore, the energy consumption results support the selection of 0.50 MPa as the optimum air-nozzle pressure for balancing yarn quality and energy efficiency.
3.6 Influence of Nozzle Pressure on Yarn Hairiness
Figure 5 shows the effect of air-nozzle pressure on the hairiness behaviour of 34 Ne CVC yarn produced by MVS III 870. The plotted curves clearly indicate that yarn hairiness decreased continuously with increasing air-nozzle pressure. This confirms that nozzle pressure has a strong influence on yarn surface characteristics.

Figure 5. Effect of air-nozzle pressure on hairiness characteristics of CVC yarn: (a) Hairiness Index (S3u/100m) and (b) Hairiness Index (H).
As shown in Figure 5(a), the Hairiness Index decreased from 648 S3u/100 m at 0.45 MPa to 590 S3u/100 m at 0.50 MPa. With further increase in pressure, the Hairiness Index dropped sharply to 462 S3u/100 m at 0.55 MPa and reached the lowest value of 435 S3u/100 m at 0.60 MPa. Overall, the Hairiness Index was reduced by about 32.9% when the pressure increased from 0.45 MPa to 0.60 MPa. The largest reduction was observed between 0.50 MPa and 0.55 MPa, indicating that this pressure range had a stronger effect on suppressing protruding fibers.
Similarly, Figure 5(b) shows that hairiness index, H, also followed a decreasing trend. The value decreased from 5.51 at 0.45 MPa to 5.25 at 0.50 MPa, then further declined to 4.96 at 0.55 MPa and 4.82 at 0.60 MPa. This continuous reduction indicates that higher air pressure produced a smoother yarn surface by increasing the wrapping action of fibers around the yarn body.
The improvement in hairiness at higher pressure may be attributed to the stronger vortex air flow inside the spinning nozzle. At higher air pressure, the wrapping fibers are more effectively twisted and bound around the yarn core, which reduces the number of loose and protruding fibers on the yarn surface. As a result, the yarn becomes smoother and more compact.
However, although 0.60 MPa produced the lowest hairiness, it should not be considered the overall optimum pressure based only on hairiness. Earlier results showed that higher pressures also increased imperfections, mass variation, waste generation, and energy consumption while reducing tenacity and elongation. Therefore, 0.60 MPa is the best condition only for minimizing hairiness, whereas 0.50 MPa remains the more balanced optimum pressure when yarn strength, evenness, imperfections, waste, and energy consumption are considered together.
The hairiness results demonstrate that increasing air-nozzle pressure improves yarn surface smoothness. The lowest Hairiness Indexes were obtained at 0.60 MPa, indicating the strongest reduction in protruding fibers. Nevertheless, considering the overall yarn quality and process efficiency, the improvement in hairiness at higher pressure must be balanced against the associated deterioration in other quality parameters. Therefore, while 0.60 MPa is preferable for surface smoothness, 0.50 MPa provides the best overall performance for 34 Ne CVC yarn production.
3.7 Statistical Significance Analysis
To rigorously assess the impact of nozzle air pressure modifications on the structural and mechanical properties of the 34 Ne CVC vortex yarn, a one-way analysis of variance (ANOVA) was executed independently for two important properties for both yarn (Tenacity and the total imperfection index (IPI)) at a 95% confidence level (α = 0.05). The statistical summaries from these analyses are compiled in Table 7 and Table 8.
Table 7: One-way ANOVA summary for yarn tenacity across different nozzle air pressures
|
Source |
DF |
Sum of Square |
Mean Square |
F Statistic |
P-value |
|
Nozzle Air Pressure (Between Groups) |
3 |
1.5725 |
0.5242 |
0.8282 |
0.4871 |
|
Experimental Error (Within Groups) |
36 |
22.7832 |
0.6329 |
||
|
Total |
39 |
24.3556 |
0.6245 |
Table 8: One-way ANOVA summary for total IPI across different nozzle air pressures
|
Source |
DF |
Sum of Square |
Mean Square |
F Statistic |
P-value |
|
Nozzle Air Pressure (Between Groups) |
3 |
749610 |
249870 |
131.3339 |
2.22e-16 |
|
Experimental Error (Within Groups) |
36 |
68492.0006 |
1902.5556 |
||
|
Total |
39 |
818102.0006 |
20976.9744 |
The statistical results demonstrate that nozzle air pressure affects yarn properties in fundamentally different ways depending on whether mechanical strength or structural mass variations are considered. As shown in Table 7, the variation in nozzle pressure does not exert a statistically significant effect on yarn tenacity (F(3, 36) = 0.8282, p = 0.4871). This indicates that while modifying the pneumatic settings shifts the absolute mean strength from a minimum of 15.18 cN/tex at 0.45 MPa to a peak of 15.72 cN/tex at 0.50 MPa, the internal variance observed within the individual tested bobbins (MSwithin = 0.6329) outweighs the variance between the pressure groups (MSbetween = 0.5242). Consequently, the core-sheath structural cohesion and base tensile strength remain reasonably robust and statistically stable within this commercial pressure window.
Conversely, the ANOVA results for the Total Imperfection Index (IPI) presented in Table 8 establish that nozzle air pressure exerts a highly significant influence on yarn mass variations (F(3, 36) = 131.3339, p < 0.001). The variance between the operational groups is exceptionally dominant relative to the random testing error (MSbetween = 249870 versus MSwithin = 1902.5556), confirming that the progressive escalation of Total IPI from 320 to 680 per km is directly caused by the altered pneumatic conditions. This statistical profile confirms that while the baseline tensile parameters are safe from mechanical degradation across these pressures, executing the process above the optimal baseline of 0.50 MPa introduces severe, statistically verified penalties in yarn mass uniformity due to excessive aerodynamic turbulence within the vortex chamber.
4.0 Conclusion
This study investigated the effect of air-nozzle pressure on the quality and efficiency of 34 Ne CVC yarn produced by MVS. The results showed that nozzle pressure strongly influenced yarn strength, unevenness, hairiness, imperfections, waste generation, and energy consumption. Among the tested pressures, 0.50 MPa was identified as the optimum setting. At this pressure, the yarn achieved the highest tenacity of 15.72 cN/tex and the lowest unevenness of 10.25%, indicating better yarn strength and regularity. Although 0.45 MPa produced the lowest Total IPI, it showed higher hairiness and lower tenacity. Higher pressures, especially 0.60 MPa, reduced hairiness but increased imperfections, waste, and energy consumption. Total wastage increased from 3.10% at 0.45 MPa to 3.95% at 0.60 MPa, while SEC increased from 2.15 to 2.45 kWh/kg. Production output remained unchanged at all pressure levels. Therefore, nozzle pressure mainly affected yarn quality and process efficiency rather than production quantity. Overall, 0.50 MPa provided the best balance between yarn quality, waste control, and energy efficiency.
5.0 Limitations of the Study
This study was limited to one yarn count, 34 Ne, and one blend ratio, 60% cotton/40% polyester. Therefore, the findings may not directly apply to other yarn counts or fiber blends. Only four nozzle pressure levels were tested, so the exact optimum pressure may require further investigation using smaller pressure intervals. Other machine parameters, such as delivery speed, draft ratio, nozzle design, and spindle diameter, were kept constant. In addition, fabric performance and detailed statistical analysis were not included in this study.
6.0 Future Research
Future studies should investigate more pressure levels around 0.50 MPa to determine the optimum setting more precisely. Research should also be extended to different yarn counts, fiber blends, and machine settings. The combined effect of nozzle pressure with delivery speed, draft ratio, and nozzle geometry should be studied using statistical optimization methods. Future work should also evaluate fabric properties, such as pilling, abrasion resistance, comfort, and dimensional stability. In addition, economic and environmental analysis should be conducted to assess the impact of nozzle pressure on production cost, energy use, and sustainability.
References
ADDIN EN.REFLIST [1] C. A. Lawrence, Advances in yarn spinning technology. Elsevier, 2010.
[2] "About VORTEX Spinning Machine." https://www.muratec-vortex.com/history/ (accessed 12 June, 2026).
[3] J. Islam. "What is CVC fabric? The Meaning of CVC in Textile." https://texsuppliers.com/what-is-cvc-fabric?srsltid=AfmBOopoMs2X_BA5fdtX2YYe2llZSfhvB96Fke-L4gn_z55JxyNZnXwH (accessed 21/03/2026.
[4] V. Yalı, R. Akdoğanözü, Y. E. Kalaycı, and F. Göktepe, "An Investigation of the Effect of Delivery Speed and Nozzle Air Pressure on Viscose Yarn Properties in Vortex Spinning," (in en), Tekstil ve Mühendis, vol. 27, no. 117, pp. 2-11, March 2020. [Online]. Available: https://dergipark.org.tr/en/pub/teksmuh/article/712523.
[5] A. K. Soe, M. Takahashi, M. Nakajima, T. Matsuo, and T. Matsumoto, "Structure and properties of MVS yarns in comparison with ring yarns and open-end rotor spun yarns," Textile research journal, vol. 74, no. 9, pp. 819-826, 2004.
[6] M. Q. Tusief, N. Mahmood, and A. H. Anjum, "The tensile properties of P/C blended yarn as affected by different process variables of Murata Vortex spinning system," Pakistan Journal of Scientific and Industrial Research, vol. 55, no. 3, pp. 149-154, 2012, doi: 10.52763/PJSIR.PHYS.SCI.55.3.2012.149.154.
[7] H. G. Ortlek and S. Ulku, "Effect of some variables on properties of 100% cotton vortex spun yarn," Textile research journal, vol. 75, no. 6, pp. 458-461, 2005.
[8] G. Basal and W. Oxenham, "Vortex spun yarn vs. air-jet spun yarn," AUTEX Research Journal, vol. 3, no. 3, pp. 96-101, 2003, doi: 10.1515/aut-2003-030301.
[9] R. M. Repon, I. Tarikul, R. Mahbubur, M. M. Abdul, and J. M. Abdul, "Characterisation of CVC yarn with different drafting ratios in vortex spinning," Fibres & textiles in Eastern Europe., vol. 29, no. 6, pp. 54-58, 2021.
[10] Z. Pei and C. Yu, "Numerical study on the effect of nozzle pressure and yarn delivery speed on the fiber motion in the nozzle of Murata vortex spinning," Journal of Fluids and Structures, vol. 27, no. 1, pp. 121-133, 2011.
[11] G. K. Günaydin and A. S. Soydan, "Vortex spinning system and vortex yarn structure," Vortex structures in fluid dynamic problems, pp. 247-269, 2017.
[12] L. Tripathi, M. Jain, and S. Ishtiaque, "Properties of air-vortex blended yarn influenced by spinning process parameters," Indian Journal of Fibre & Textile Research, vol. 46, no. 3, 2021.
[13] P. Dutta, M. Sufian, and I. Hossain, "Effect of Air Pressure on The Cotton/Polyester Blended Vortex Spun Yarn Properties in Terms of Uniform Yarn Count," in International Conference on Multidisciplinary Research & Development, 2021, doi: 10.17605/OSF.IO/MHVAD.



Georgia Reader Reply
Et rerum totam nisi. Molestiae vel quam dolorum vel voluptatem et et. Est ad aut sapiente quis molestiae est qui cum soluta. Vero aut rerum vel. Rerum quos laboriosam placeat ex qui. Sint qui facilis et.